
What Sets 2026 Reports Apart
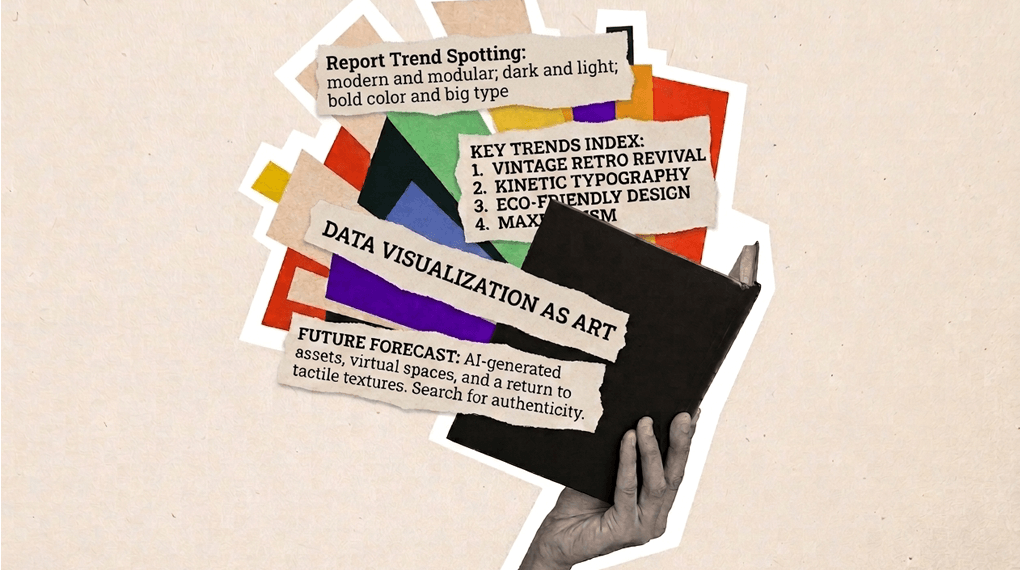
Five design archetypes and why they’re trending now.
“It’s always about timing. If it’s too soon, no one understands. If it’s too late, everyone’s forgotten.”
I found this quote on various corners of the internet attributed to Anna Wintour, Vogue’s longtime editor-in-chief who recently became chief content editor at Condé Nast. This is a woman who understands trends and why they matter — whether you choose to opt in or not. (If you’ve seen “The Devil Wears Prada,” that’s what the Wintour-inspired “cerulean blue” monologue is about.)
CRI is not in the business of fashion, but report design is one of our core competencies, and after more than 40 years, we’ve seen our share of trends in the space come and go. Looking through our archives, it’s sort of fascinating to notice how reports have evolved, largely in line with broader landscape and cultural shifts. Monitoring these trends helps us see where things are going and what makes a report feel dated. The goal is never to create a report that looks like everyone else’s, but as Wintour indicates, a sense of trend can help you publish a report that feels right on time.
Trend spotting is a favorite activity for me and Melanie Prisco, CRI’s vice president of design. This summer, we’ve been reviewing new reports — both ones we’ve worked on at CRI and others we’ve seen “in the wild.” We’ve identified five design archetypes, along with theories about why they’re gaining popularity. We’re looping you in so you can stay two steps ahead and, perhaps, find some inspiration as you envision your next report.
1. Modern and Modular
Most audiences are now digital-first readers, used to consuming information via computers, tablets and phones. Several of the latest reports reflect that — even as many remain in the form of a printable or downloadable PDF. Think:
- Content written in modular chunks that replace or break up the running narrative
- An emphasis on sleek, modern design
- Rounded rectangles, glass effect and other elements that mimic a screen
- Navigation bars and links that feel like digital toolbars and toggles
From Amazon to Meta to Microsoft, tech-forward riffs on this trend abound, but let’s look to Delta’s 2025 Difference Report as one of the clearest examples. Many of the design elements read like a virtual dashboard or widgets on a screen. This makes the report easy to scan, an important feature, as we know many audiences don’t read reports page by page. Delta isn’t just reflecting this shift in its designs but also in how it delivers content, with web-exclusive resources prominently featured on section intro pages and the table of contents. We predict that this trend will not only continue but gain steam as many companies shift to a highly integrated online hub and PDF reporting model.
2. Dark and Light
One night and day shift we’re noticing: the prevalence of moody, high-contrast palettes. A prime example is Apple’s 2026 Environmental Progress Report, where black backgrounds make products and strategies feel both eye-catching and elegant. Lighter pages with pops of color balance things out, preventing the report from getting too heavy or stark. Companies also can achieve this with color. Siemens Impact 2025 Report uses high-contrast backgrounds in a style we’ve deemed “cosmic,” “cyberpunk,” or “dark-mode tech”. Micron’s 2026 Sustainability Report falls somewhere in the middle, using both “dark mode” elements and gradient accents.
We see a correlation between this trend and a shift to more business-aligned reporting. High-contrast moments move reports away from feeling “warm and fuzzy” toward a tone that is more confident, impactful and direct.
3. Bold Color, Big Type
Speaking of impact, we’re seeing this come to life through reports that embrace bold color palettes and supersized type. Picture:
- Big, bold headlines
- Quotes and key statements scaled up to fill a two-page spread
- Full-page metrics and charts
- Strong colors that make content pop and orient readers across sections
Cotopaxi’s 2025 Impact Report is a good example, but we’ll point you to Patagonia’s 2025 Impact Report as the poster child of this trend. Here, it’s not just the design, but the writing that stops you in your tracks. Magnified headlines reading “nothing we do is sustainable” feel a bit provocative and surprisingly frank — maybe a risky move but one that ultimately instills trust. This report is also an exercise in smart pacing. Rather than maximizing the content capacity of every page, Patagonia scales up headlines and charts, giving the eye a moment to pause and helping readers absorb the bigger message.
4. Artistic
In a time when many reports feel screen-ready, some stand out by going the other way. Art-driven visuals can add an unexpected touch of personality, individuality and craft. LVMH’s painterly illustrations caught our eye while reviewing the 2025 Social and Environmental Responsibility Report. The use of these illustrations — even on infographic and data-focused pages — works surprisingly well and makes sense for a business selling artistry and style.
Progressive — a very different type of business — used a similar approach in its 2024 Corporate Sustainability Report, showcasing pieces from its Contemporary Art Collection, selected for how they represent the theme of “purpose”. Even in a two-dimensional report, the featured works give pages a tactile feel while paying off the theme with visuals that are specific, rather than generic.
5. Immersive Narrative
They say a picture is worth 1,000 words, and in these reports, the cliché holds true. Photography plays a starring role in the immersive narrative theme, drawing the eye in and deepening the story. The effect tends to feel editorial and even a bit cinematic. We’ve seen nice examples in some annual reports, as well as feature journalism (especially in magazines) and brand impact decks.
We like how Virgin Voyages embraced this technique for a distinctly editorial 2026 Impact Report. The style also works well to set off specific feature and topic pages. Both Sysco’s FY2025 Sustainability Report (see p. 48 for a nice feature execution) and Cisco’s FY25 Purpose Report (see p. 10 for strong section intro messaging) come to mind. A great example is the Climate Strategy page (p. 23) in Ulta’s 2025 Corporate Responsibility Report. This could have been a technical narrative with a windmill; instead, the design feels compelling and keeps the human element of climate action at the forefront. Photo choice is key here; successful examples use imagery with a clear focal point and some open space for data and text.
Remember: To successfully execute a creative concept, you must first master the fundamentals.
There’s one thing every report we loved had in common: A fundamental understanding of what makes or breaks report design. These are unique animals, content-wise — we like to think of them as unicorns — containing everything from data to long-form copy to feature-style pages. This can pose real challenges when trying to make a design feel both functional and cohesive. Over the years, we’ve developed some tricks for getting it right.
For a primer, read Melanie’s recent blog on what she calls our purposeful design approach. Then, set aside your lunch break to watch our recent webinar on design trends. We discuss how purposeful design unfolds in practice and share more examples of the archetypes above. If you find yourself with questions or a big idea you’d like to think through, we hope you’ll reach out.